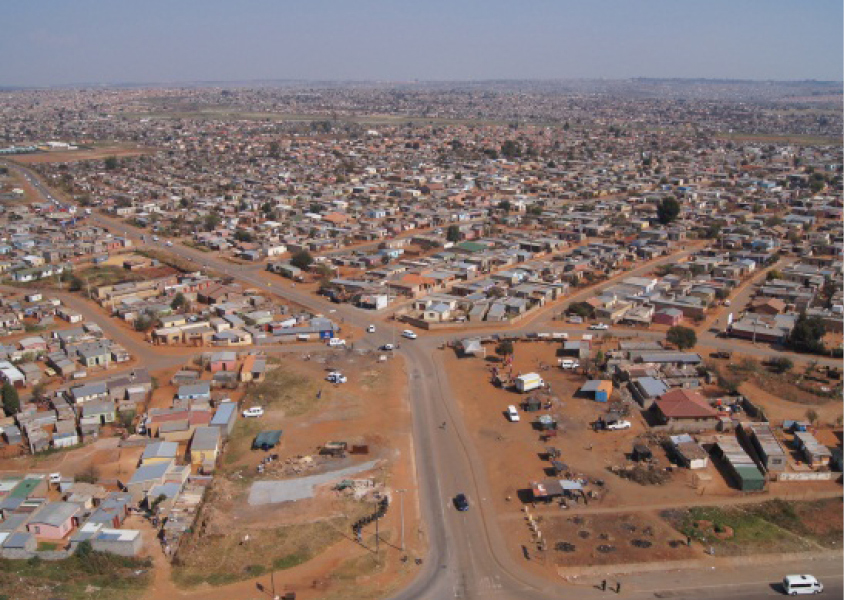
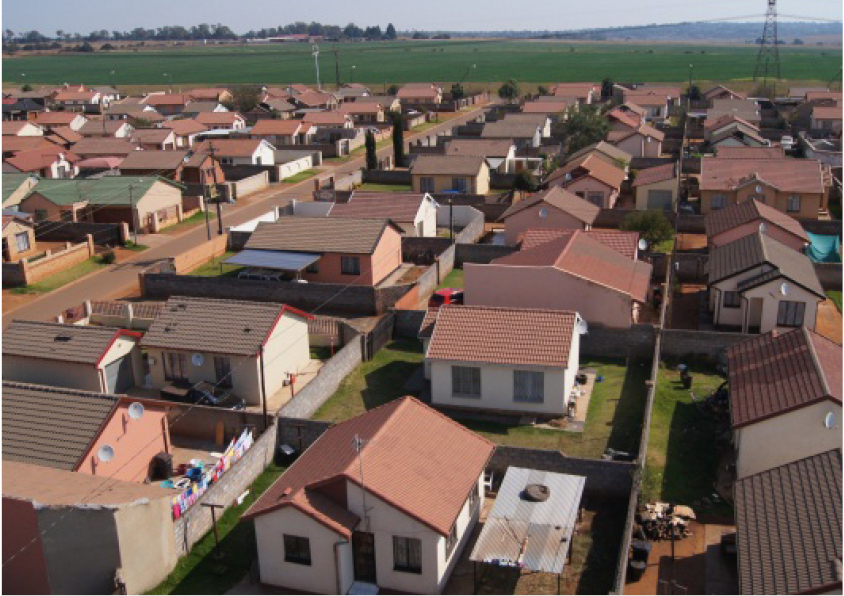
A remarkable picture of the dramatic urban growth in the last two decades is evident in the GCR.
The study revealed that the percentage of urban (i.e. built-up) land cover/use in Gauteng has dramatically increased from 12,6% in 1991 to 18,4% in 2009. Urban growth corresponds with a drastic decline in the percentage of woodlands and a slight increase in the percentage of grasslands and can be attributed to the proliferation of informal settlements, government RDP housing projects and the development of new office and industrial parks, residential estates, shopping complexes and commercial nodes.
Urban land cover
|
|
1991 |
2001 |
2009 |
|||
|
Land-use/cover class |
Ha |
% |
Ha |
% |
Ha |
% |
|
Water |
35 707,71 |
1,97 |
34 350,43 |
1,89 |
32 002,60 |
1,76 |
|
Urban (built-up) |
228 791,82 |
12,60 |
289 781,31 |
15,95 |
333 457,56 |
18,36 |
|
Mines |
26 362,64 |
1,45 |
26 584,67 |
1,46 |
19 320,06 |
1,06 |
|
Cultivated (crop & pasture) |
391 787,26 |
21,57 |
391 460,73 |
21,55 |
386 942,72 |
21,30 |
|
Grasslands |
890 463,40 |
49,03 |
918 737,59 |
50,57 |
934 043,39 |
51,42 |
|
Woodlands |
174 602,38 |
9,61 |
75 111,73 |
4,2 |
62 620,52 |
3,45 |
|
Wetlands |
39 788,39 |
2,19 |
28 849,97 |
1,59 |
32 150,38 |
1,77 |
|
Bare |
28 564,33 |
1,57 |
51 723,21 |
2,85 |
15 841,93 |
0,67 |